Powering Security Reports with Cartography and Flyte
Introduction
One of the Security Team’s projects this year has been to make it easy to generate reports and dashboards from Cartography, Lyft’s security intelligence graph. Cartography links together various entities like compute, permissions, Github repositories, users, etc. and has powerful query capabilities, but it does not integrate with our analytics tools out of the box. To remedy this we’ve leveraged Lyft’s data infrastructure to build an ETL solution that extracts data from Cartography and transforms it into something that can be consumed by our analytics tools. Our solution improves on older approaches by being both significantly easier to work with and more powerful.
Applications
We are using this system to drive dashboards for several important projects. First, there is Vulnerability Management, which includes tracking container vulnerabilities. For our example above, the ETL provides us with a list of every single container vulnerability present in our system, with information on the owning team/service, making it easy to identify services and teams with the most vulnerabilities. Our (redacted) dashboard looks like so:

This of course is just a snapshot for a given day. As vulnerabilities are fixed they no longer appear in Cartography, and thus our vulnerability count decreases over time. One of the nice things about having this data in S3 is that we can retain it for as long as we want and we can perform more in depth analysis on this data that we could not do if we just stored aggregations. For example if there is a security incident, we can look at the complete list of vulnerabilities that are present in the affected service when the incident happened.
Another exciting project is minimizing dependency drift. Security and Infrastructure both want to minimize the number of versions of libraries in Lyft services, ideally moving to the newest versions. This minimizes the impact of vulnerabilities in legacy versions of the libraries, keeps us up to date on bug fixes and makes the behavior of a given library more predictable across our infrastructure. Using ETLs we can query Cartography for Python dependencies and versions by service, which allows our infrastructure team to track their progress as they roll out tools to drive automated dependency upgrades.
History
Under the hood Cartography stores data in Neo4J, which allows us to use the powerful Cypher query language to perform complicated graph queries in a concise fashion. However, most analytics platforms (e.g., Superset, Mode) do not support Cypher as a native query language. Either we can translate Cypher to SQL, or write pre-canned queries and store their results in an intermediate location that can be queried with SQL.
Translating Cypher to SQL is painful. There have been various OSS attempts but all ended up as abandonware (Cytosm, Cyp2sql, Morpheus).
Neo4J offers a JDBC connector that translates SQL to Cypher on the fly, but this requires the user to install the connector on their analytics platform of choice. One concern is schema translation; the conversion performed by the connector may not map to what we have in our heads. In any event we never go that far — Lyft uses Mode Analytics, which does not support custom JDBC drivers.
In early 2020 and before, Lyft used a system called Juicer to “juice” the graph using cron jobs and store the results in MySQL/RDS. This worked, but the maintenance burden of the RDS instance and cron jobs was not trivial. Outside of Lyft, one of Cartography’s main contributors, Marco Lancini used a similar approach, storing the results of cron-driven queries in Elasticsearch, and creating dashboards with Kibana.
A New Approach
ETLs >>> Crons
Given that we wanted to run recurring queries, our high-level implementation required either cron jobs or ETLs built on top of Lyft’s data infrastructure. For our use case ETLs were superior in all important respects (your mileage may vary if you don’t have your own data infrastructure team).
First, at Lyft our data infrastructure is substantially easier to use than cron jobs, with lots of tooling to assist development and operations. Most development can be done with Jupyter notebooks hosted on Lyftlearn, Lyft’s ML Model Training platform, allowing access to staging and production data sources and sinks. This lets engineers rapidly prototype queries and validate the resulting data. For managing ETLs in production, we use Flyte, a data processing and machine learning orchestration platform developed at Lyft that has since been open sourced and has joined the Linux Foundation. The experienced engineer might ask “Why not Airflow? Lyft has that too!”. The answer boils down to that at Lyft, Flyte is the preferred platform for Spark for various reasons from tooling to Kubernetes support.
Second, ETLs support the notion of dependencies, representing workflows as a directed acyclic graph. Workflows can consist of multiple tasks- for example run a query, then generate a report, and then generate a dashboard, but only if the previous tasks succeed. Building on this, we can reuse the task logic for many different workflows, greatly simplifying development. Each of these steps can be prototyped inside a notebook, and then turned into library functions once everything works. These functions can then be reused not only in workflows but in notebooks used for ad-hoc analysis.
Third, our data infrastructure uses S3 as storage with Presto and Spark to interact with the data, which means we don’t need to maintain our own storage infrastructure and can use modern big data tooling. End users can use familiar SQL/Presto queries, and engineers can build powerful Spark jobs for more in-depth analysis. We also can customize data retention, which is useful for example where we want to examine the differences in container vulnerabilities over the course of an entire year.
Architecture
The system design is straightforward- we use Flyte to run our ETLs, and these ETLs extract information from Cartography and load it into S3, and then interact with other services like Mode to refresh reports and Slack to notify users. Additionally users can use Mode or their SQL-enabled analytics platform of choice to query the data ad-hoc. The system at a high level looks like so:
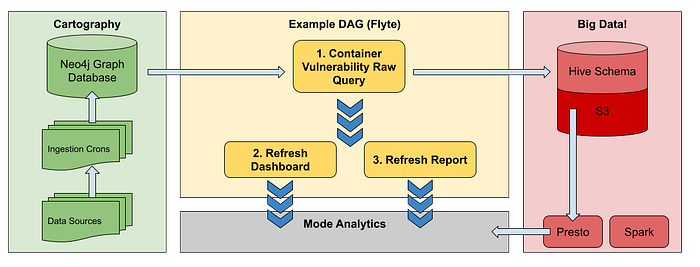
The example DAG powers a dashboard and a report for container vulnerabilities. A Cartography query generates data, which is then stored in S3 with an associated Hive schema. Next we make API calls to Mode to refresh our dashboard and our report. Finally, Mode then makes a query to populate the dashboard and report with new data.
Implementation
The first step of our DAG is an ETL that extracts data from Neo4J, transforms it (adding dates and such), and finally loads it into S3.
rows = extractNeo4jData(neo4j_driver=neo4j_driver)pdf = createDataframe(rows=rows)loadDataframe(pdf=pdf, s3_path=s3_path, table=hive_table)
We extract the Neo4J data as a series of rows:
def extractNeo4jData(neo4j_driver: neo4j.Driver) -> List[List[Any]]:
    rows: List[List[Any]] = []
    with neo4j_driver.session() as session:
        result = session.run(cypher_query)
        for line in result:
            rowData: List[Any] = [
                line["cve_id"],
                line["severity"],
                line["description"],
                line["ecr_image_id"],
                line["pkg_id"],
                line["scan_completed_at"],
                ...
            ]
            rows.append(rowData)
    return rows
These rows map to a Spark schema:
schema = StructType([
    StructField('cve_id', StringType(), True),
    StructField('severity', StringType(), True),
    StructField('description', StringType(), True),
    StructField('ecr_image_id', StringType(), True),
    StructField('pkg_id', StringType(), True),
    StructField('scan_completed_at', IntegerType(), True),
    ...
])
Next we use pyspark’s createDataFrame function to transmogrify our neo4j data and schema into a dataframe, and then transform the timestamp columns and add a datestamp column for easy partitioning in S3:
def createDataframe(rows: List[List[Any]]) -> pd.DataFrame:
    with get_spark_session() as session:
        today = str(date.today())
        df = session.createDataFrame(data=rows, schema=schema)
        df = df.withColumn('ds', lit(today).cast(StringType()))return df.toPandas()
Finally the dataframe can be saved to S3 with a Hive schema, and this can be queried by Mode, or in other cases follow-on tasks.
def loadDataframe(pdf: pd.DataFrame, s3_path: str, table: str) -> None:
    with get_spark_session() as session:
        df = session.createDataFrame(pdf)
        df.write.partitionBy(['ds']).mode('overwrite').option('path', s3_path).saveAsTable(table)
Closing Thoughts
Improving visibility into security data is crucial for all sorts of things. Using a modern data orchestration platform gives us powerful and easy-to-use tools to ingest and process this data. Jupyter notebooks make prototyping easier and faster, and an ETL based workflow provides a more robust approach to surfacing our data in our analytics platforms compared to the legacy cron approach. Moreover, we can leverage Spark for sophisticated analysis and machine learning. We’ll cover interesting uses of Spark from a security perspective in a future blog post!
References
If you would like to learn more about Lyft’s security and data infrastructure, please check out the following links:
Lyft Security is hiring! If you’re interested in working with tools like Cartography, join us!